Overall Risk provides an overview of the overall risk status of your organization. It displays the entity type, its top five risky entities, and the accumulated risk of all the entities in an overall risk graph. It also indicates the risk level and risk trend to determine if the risk is escalating or diminishing along with the total number of analyzed events and detected anomalies. At the top, you can view the data ingestion period. UEBA runs the analytics on the data ingested between the start and end date of this period. You can also generate reports by clicking on Report.
In Overall Risk, you can view:
Overall Risk Level (low, medium, high, extreme) and risk score.
Overall Risk Trend (increasing, decreasing, remaining constant).
Number of Events Analyzed by the analytics during the specified period.
Number of Anomalies Found by the analytics during the specified period.
Overall risk chart.
Top five risky entities for each entity.
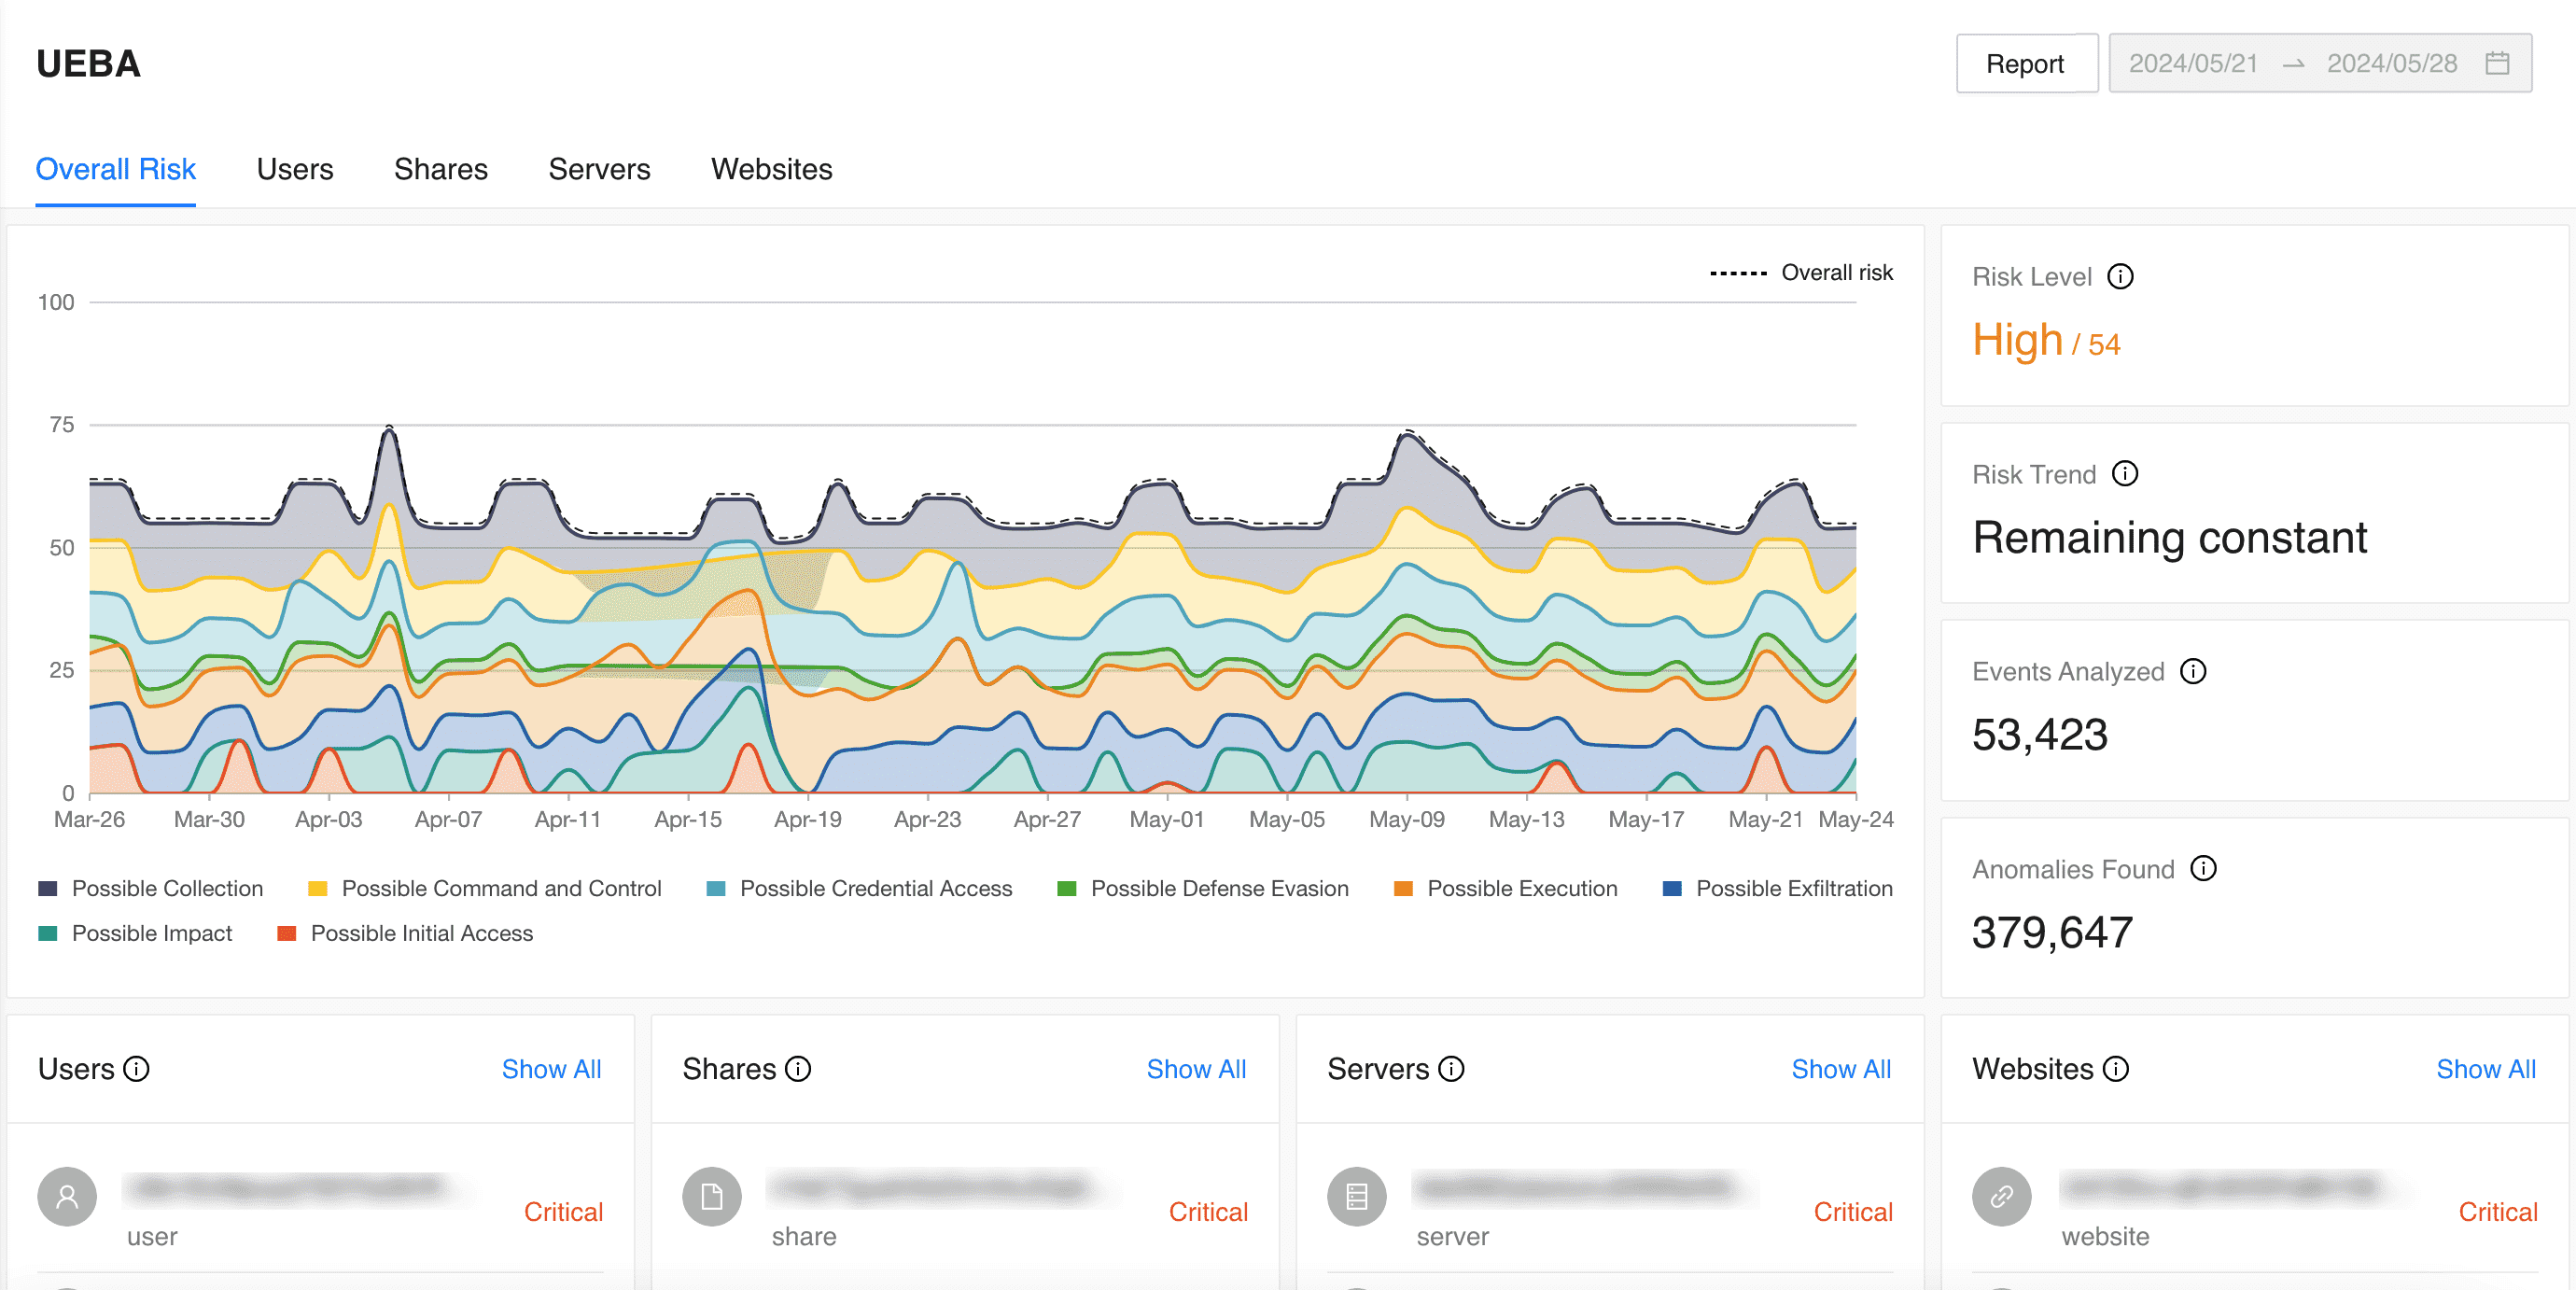
Overall Risk Page
Overall Risk Chart is a stacked area chart that shows the overall risk score and contribution of each of the Threat Types to the overall risk score. It displays the time range in the X-axis and the risk score in the Y-axis. The colored areas represent the types of threats detected.
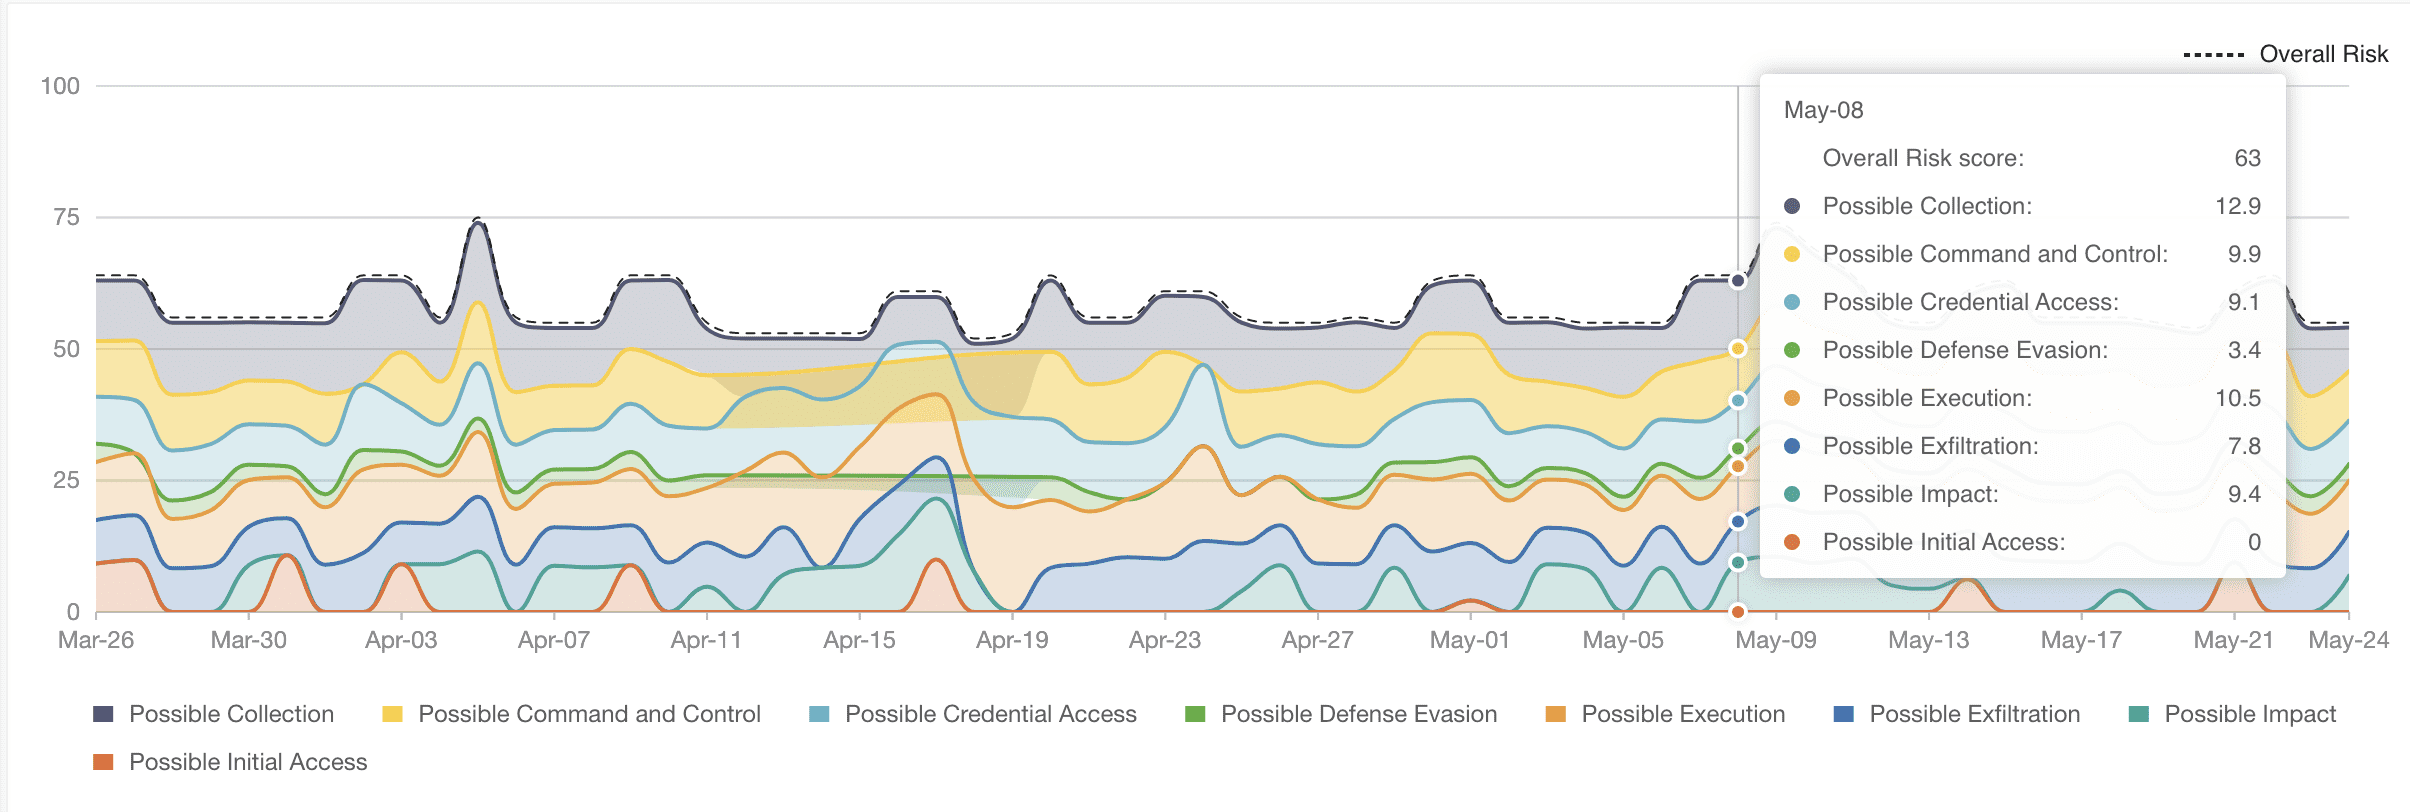
Overall Risk Chart
In the chart, you can:
View/hide each threat type in the chart by clicking the threat type in the legend. By default, all the threat types are displayed.
Click any threat type in the chart to view the details. You’ll be redirected to Users with the respective threat type filter.
By default, a maximum of 100 days of data is displayed in the chart.
The top five risky entities detected from the latest analysis are listed according to entity type. You can see their risk scores by hovering over the risk level. Clicking on Show All redirects you to the individual entity’s page. You can also see the risk trends of the each entity in Matrix of Anomalies. The entity page shows data for the past 7 days by default.
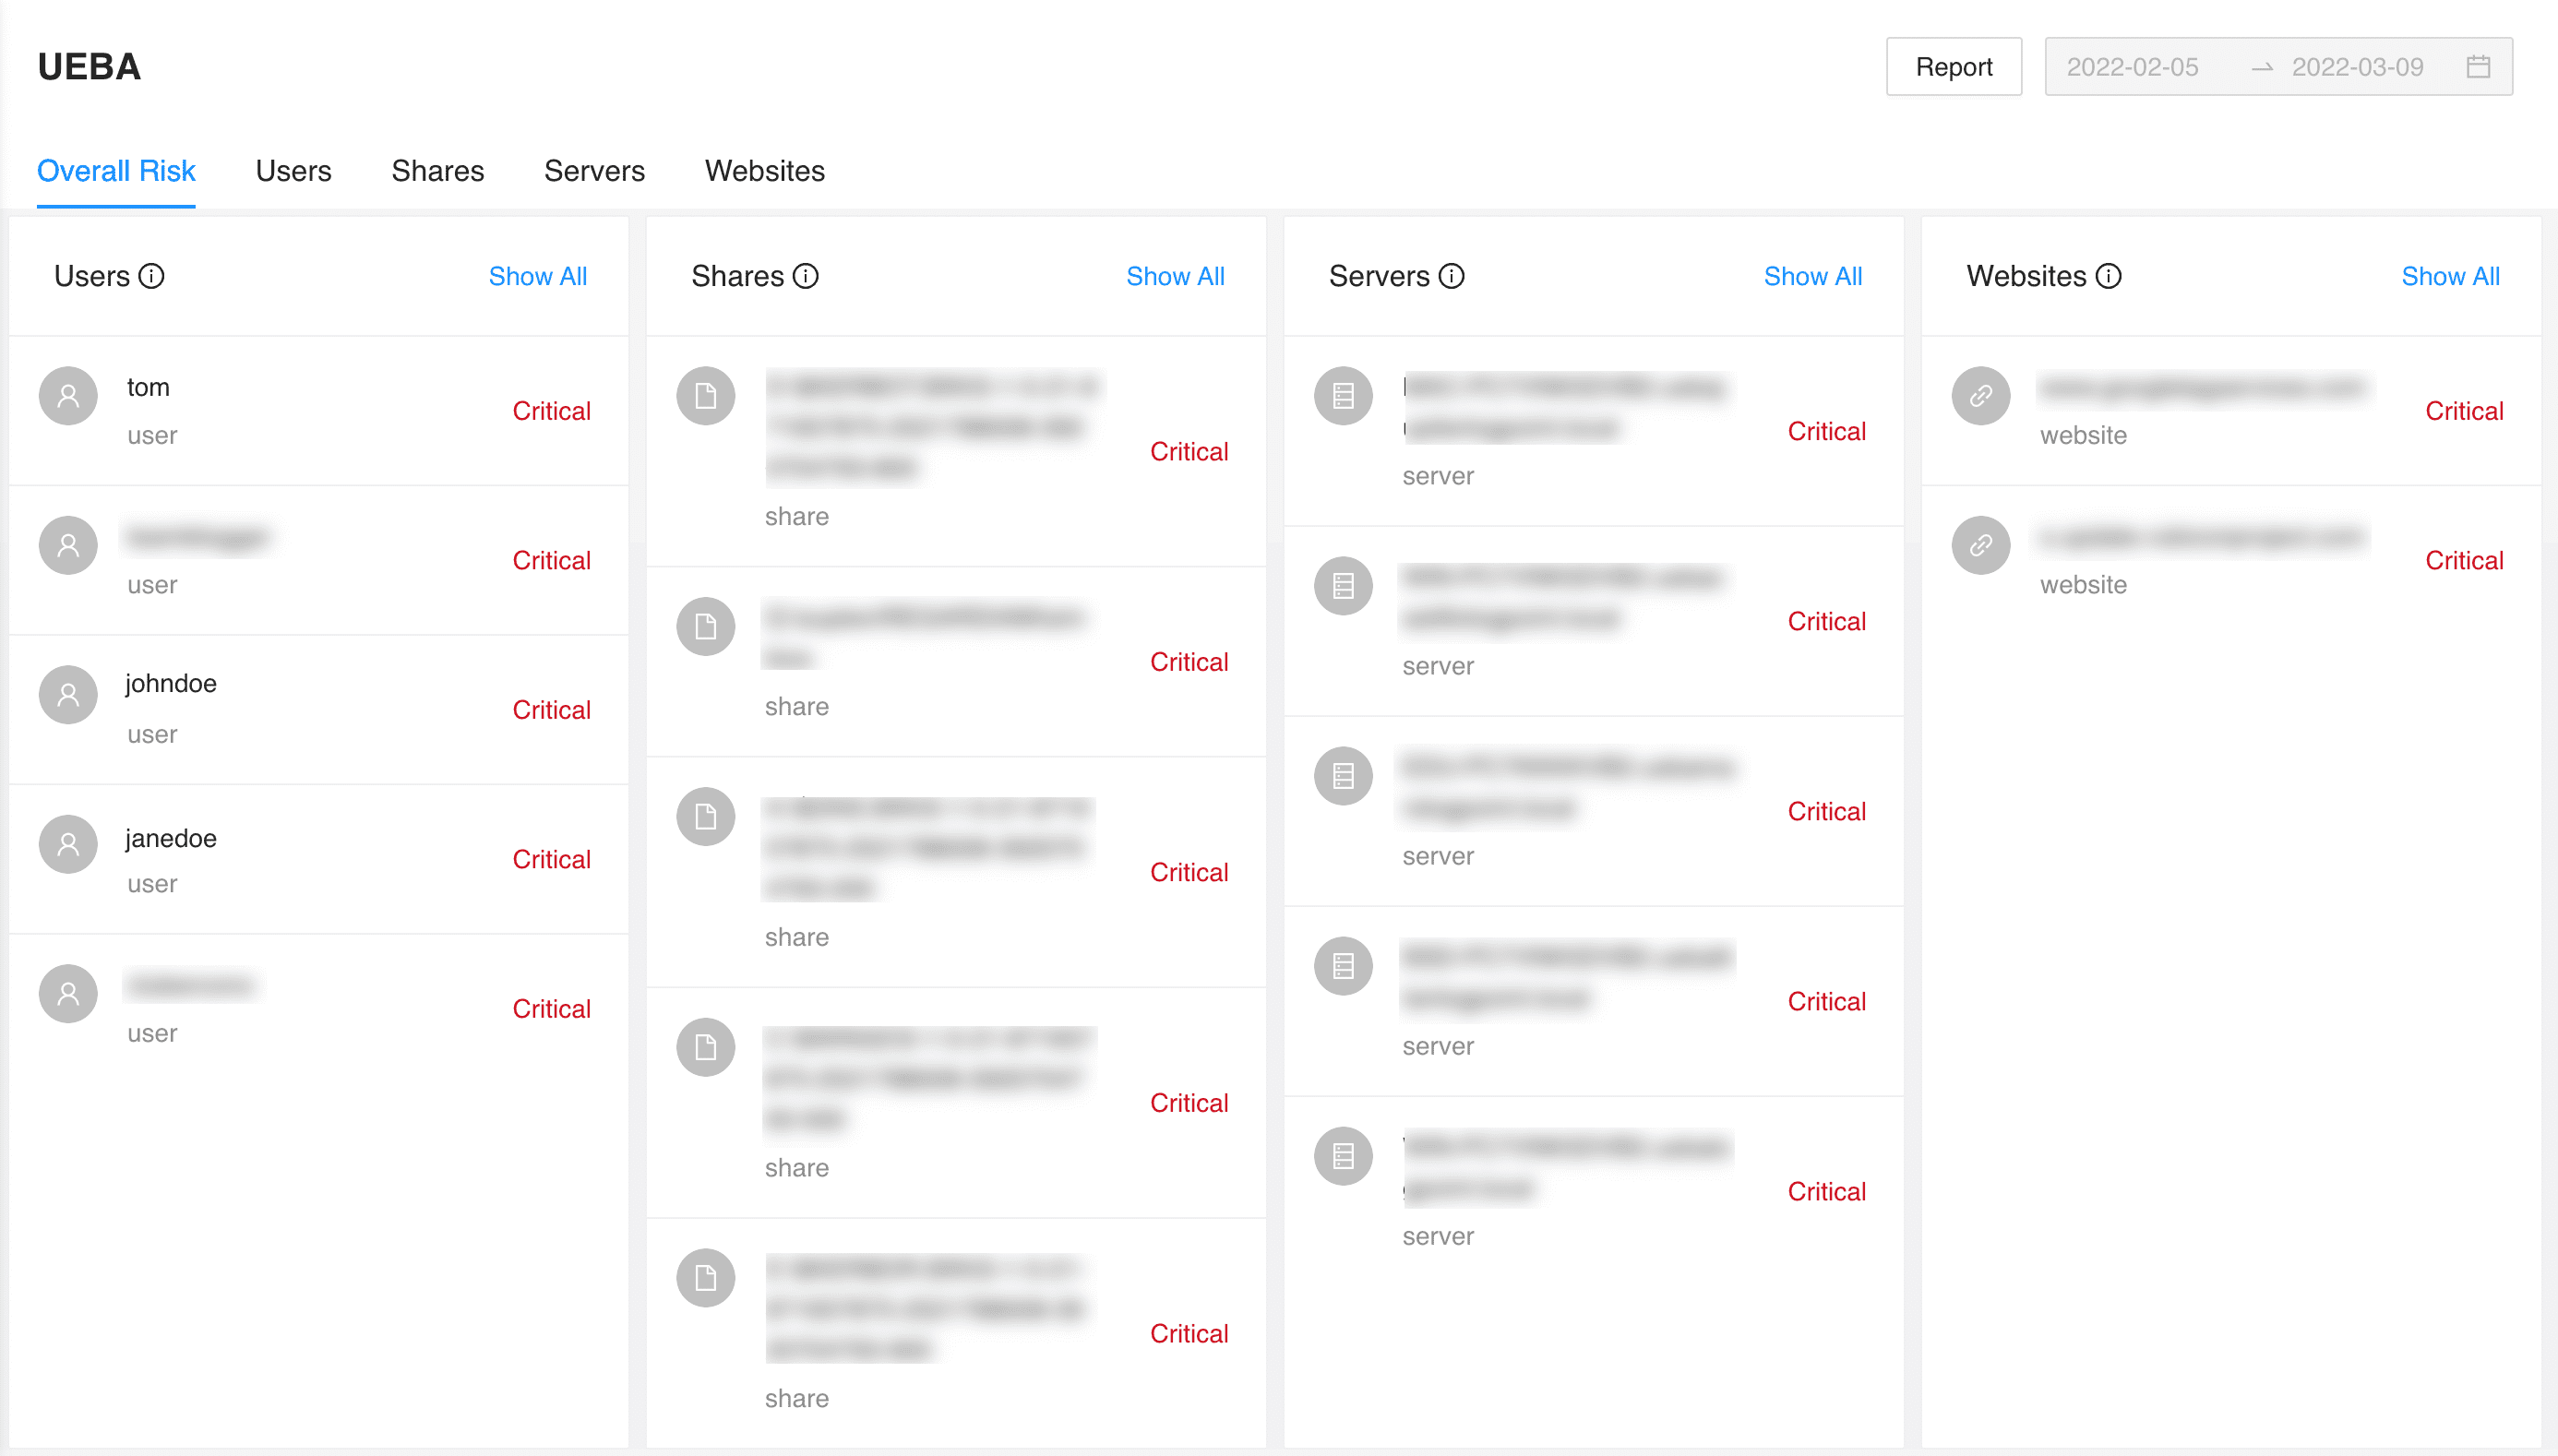
Top Five Risky Entities of Each Entity Type